The Federal Reserve Bank of Philadelphia has released the coincident indexes for the 50 states for September 2019. Over the past three months, the indexes increased in 42 states, decreased in six states, and remained stable in two, for a three month diffusion index of 72. In the past month, the indexes increased in 39 states, decreased in eight states, and remained stable in three, for a one-month diffusion index of 62.
emphasis added
Note: These are coincident indexes constructed from state employment data. An explanation from the Philly Fed:
The coincident indexes combine four state-level indicators to summarize current economic conditions in a single statistic. The four state-level variables in each coincident index are nonfarm payroll employment, average hours worked in manufacturing by production workers, the unemployment rate, and wage and salary disbursements deflated by the consumer price index (U.S. city average). The trend for each state's index is set to the trend of its gross domestic product (GDP), so long-term growth in the state's index matches long-term growth in its GDP.
 Click on map for larger image.
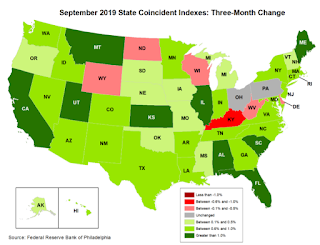
Here is a map of the three month change in the Philly Fed state coincident indicators. This map was all red during the worst of the recession, and all or mostly green during most of the recent expansion.
The map is mostly green on a three month basis, but there are some red and gray states.
Source: Philly Fed.
Note: For complaints about red / green issues, please contact the Philly Fed.
 And here is a graph is of the number of states with one month increasing activity according to the Philly Fed. This graph includes states with minor increases (the Philly Fed lists as unchanged).
In September, 42 states had increasing activity (graph includes minor increases).
All Rights Reserved © 2024


