Most observers are aware of the rising cost of state and local government employee retirement plans, driven by benefit increases, overoptimistic investment return assumptions and failures by governments to make full contributions as required. But in a recent study, the National Conferences of Public Employee Retirement Systems (NCPERS) cites federal government data to argue that public sector pensions remain easily financially sustainable by state and local governments.
In fact, though, those same federal data show that public pension debt is rising significantly faster than the growth rate of the economy, with pension liabilities doubling as a percentage of GDP over the past three decades. Worse, state and local government pensions are failing even to fully fund the new benefits earned by employees each year, much less rebuilding their troubled finances. All of this points to difficult decisions ahead, not to a future in which, as the NCPERS study concludes, "the data clearly demonstrate that public-sectors employers' economic capacity to handle that debt is also increasing."
The NCPERS study rightly states that "policy makers need to examine the trends in the ratio between pension debt and GDP to get a realistic picture about sustainability of public pensions." What is more questionable is NCPERS' conclusion: "Our analysis ... shows that this ratio has been stable and is likely to be stable over the next 30 years with minimal adjustments."
Indeed, the same data NCPERS relies on appear to show a very different story - that public pension liabilities, funded or unfunded, have increased dramatically over the years.
NCPERS uses data from the Federal Reserve's Financial Accounts of the United States publication. The Fed's pension data in turn are drawn from the federal Bureau of Economic Analysis (BEA), which prepare these data as part of the National Income and Product Accounts.
The Fed/BEA pension data show that immediately following World War Two, total state and local government liabilities were equal to only seven percent of gross domestic product (GDP). Pension liabilities grew to around twenty percent of GDP by 1970, remaining at more or less that level through the late 1980s. But beginning in 1989 pension debt began a long and dramatically higher upward path, with total pension liabilities reaching 41% of GDP in 2019.
State and local government employee pension liabilities have doubled as a percent of GDP over the ... [+] 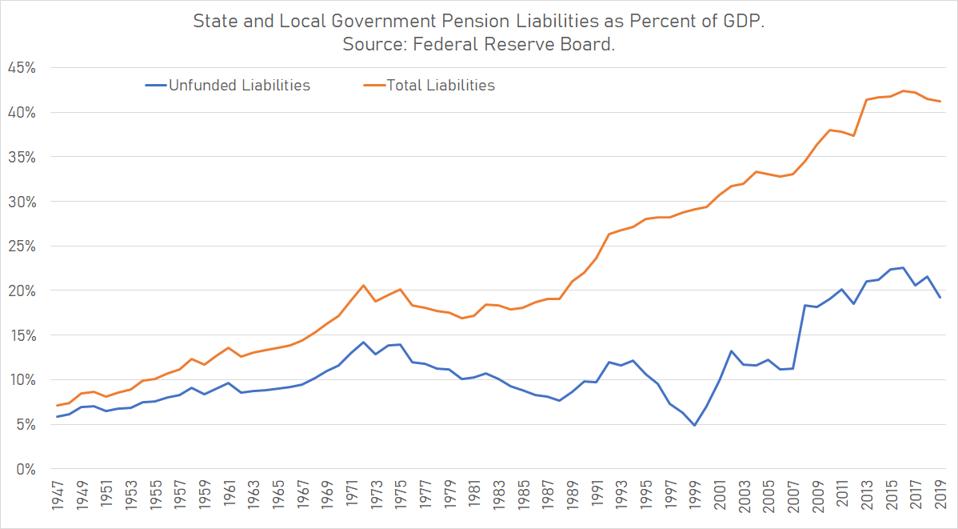
The unfunded share of state and local pension liabilities has increased as well. Up through the 1970s many public sector pensions were funded on a pay-as-you-go basis, meaning that benefits were paid directly via tax revenues with no attempt at prefunding. In 1947, for instance, unfunded state and local pension liabilities equaled 5.8% of GDP at a time when total pension liabilities were just 7.1%. Over time, state and local governments moved to prefund their pension benefits, such that pension assets grew considerably. By itself, that's a good move.
But all of this pension prefunding - and then some - was offset by increases in the cost of public pension benefits. In fact, unfunded public pension liabilities today are higher than in the years when state and local governments made little effort to fund pensions at all. For instance, even in public pensions' best-funded year of 1999, total unfunded liabilities were nearly as large as in 1947, when pension funding was almost nonexistent. This merely illustrates the degree to which state and local government pension systems have grown.
So, given all that, how does the NCPERS study conclude that public pension liabilities are both modest and sustainable? It's a little hard to follow their calculations, and a number of mathematical steps NCPERS takes don't affect the trends very much.
But one does: NCPERS' standard for sustainability is "how much more money should have been contributed into pension funds to keep the ratio stable," which NCPERS defines as "at or below the average during the 16-year period (2002-2017)."
So what NCPERS does is take a subset of the much longer period over which pension liabilities have skyrocketed and then, by looking at the average increase in pension debt over that subset, effectively cut even that amount in half. The soft bigotry of low expectations.
Specifically, from 2002 to 2017 unfunded pension liabilities rose from 13.2% of GDP to 20.6%, an increase of 7.4% of GDP. The average increase during that period would be roughly half that amount, or 3.7% of GDP. But that's a pretty modest goal when, over the past 30 years, unfunded state and local pension liabilities increased by 10.6% of GDP, nearly three times as much. In effect, NCPERS asks how much it would costs to stabilize pension debt as of the beginning of Barack Obama's second term, when pension debt began its long upward climb back when George Bush - the first one - entered office.
And it's hard to portray that increase as benign, even if no state pension plan has yet gone insolvent. For instance, on paper, education funding per student has increased significantly over the years. But a substantial part of that increased funding doesn't come anywhere near the classroom but instead goes to pay off unfunded liabilities for teacher pension plans. We see the same effects elsewhere as rising pension costs squeeze resources available for other purposes.
But there's worse: the Federal Reserve/Bureau of Economic Analysis data show that state and local pensions aren't even treading water, much less making up for lost ground. In fact, state and local pensions aren't even receiving sufficient contributions to cover the new benefits accruing to employees each year. Simply to stay even, total pension contributions would need to roughly double or the rate at which future benefits are earned would need to be cut in half. That's not a modest difference.
State and local government pensions receive cash contributions equal to only half the value of ... [+] 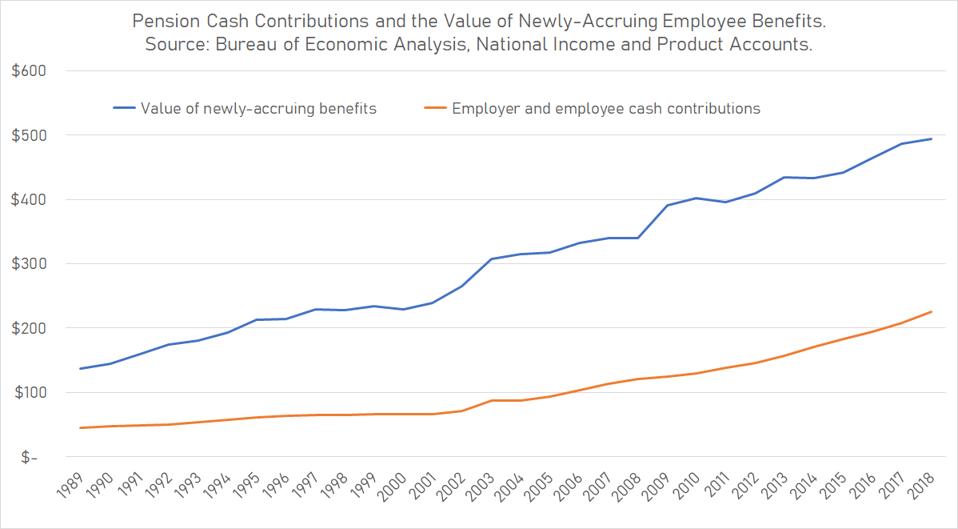
It's hard to say whether any given level of public pension debt is sustainable, much less optimal. But it's easy to say that when the ratio of debt to GDP is rising - and shows no sign of stopping - that the growth of pension debt is unsustainable. Debts can't rise faster than GDP forever. At some point it must stop, one way or the other. The question is when, how and who bears the costs?
...
All Rights Reserved © 2024


